Star system · Products & platforms
SignalMap
A mobile coverage map of Réunion and Mayotte: click anywhere and see the signal you would get from about 3,100 antennas.
- Orbit period
- Jan 2026 – now
- Role
- Developer, then maintainer
- Crew
- 4 people
- Status
- maintained
Spectral lines
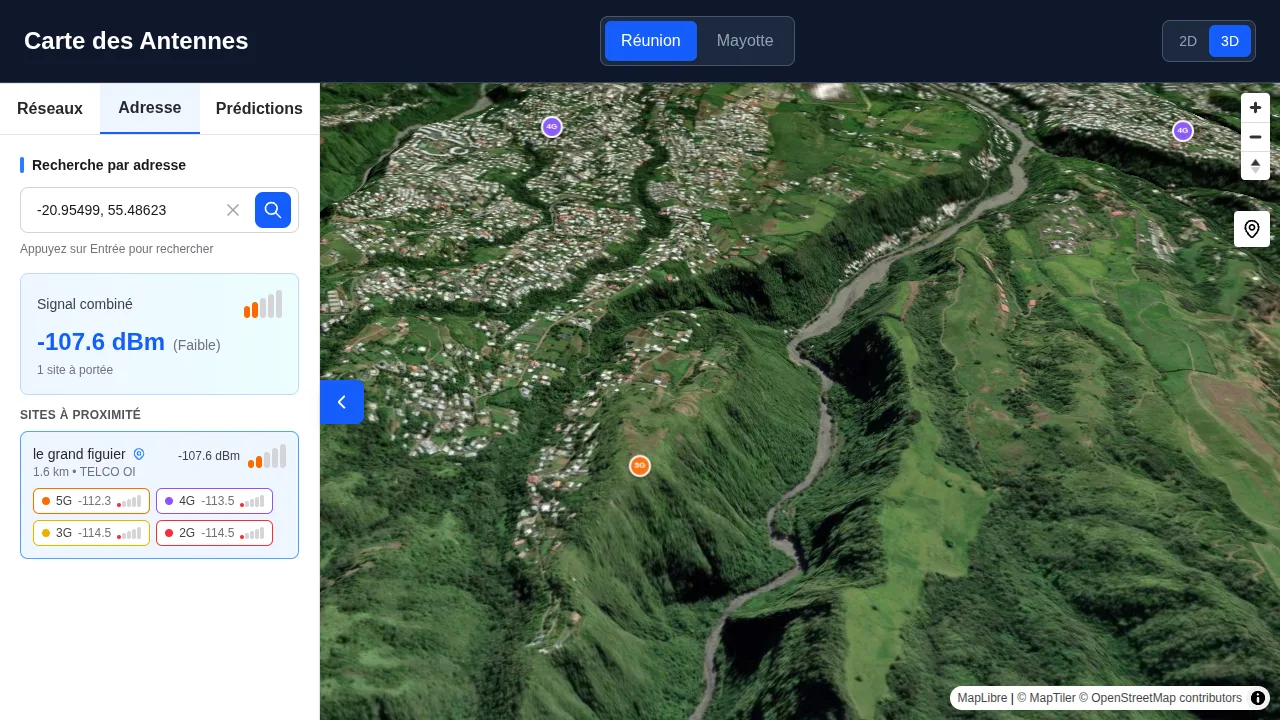
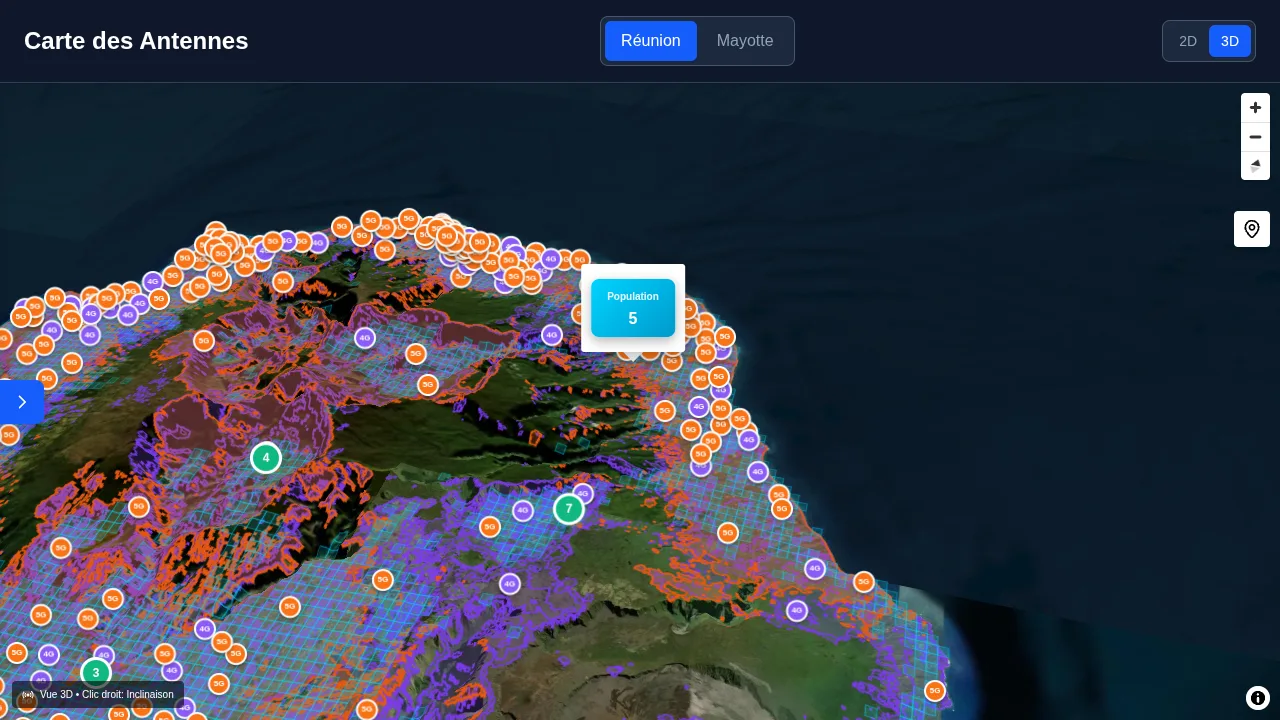
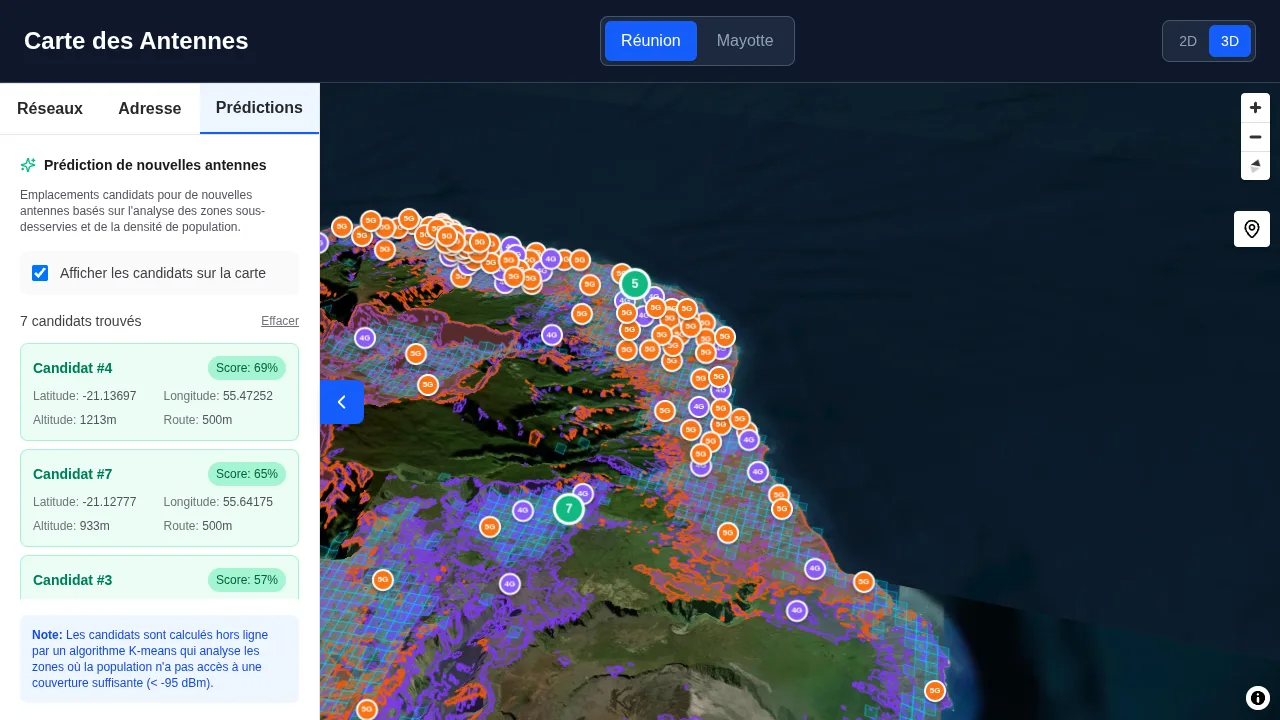
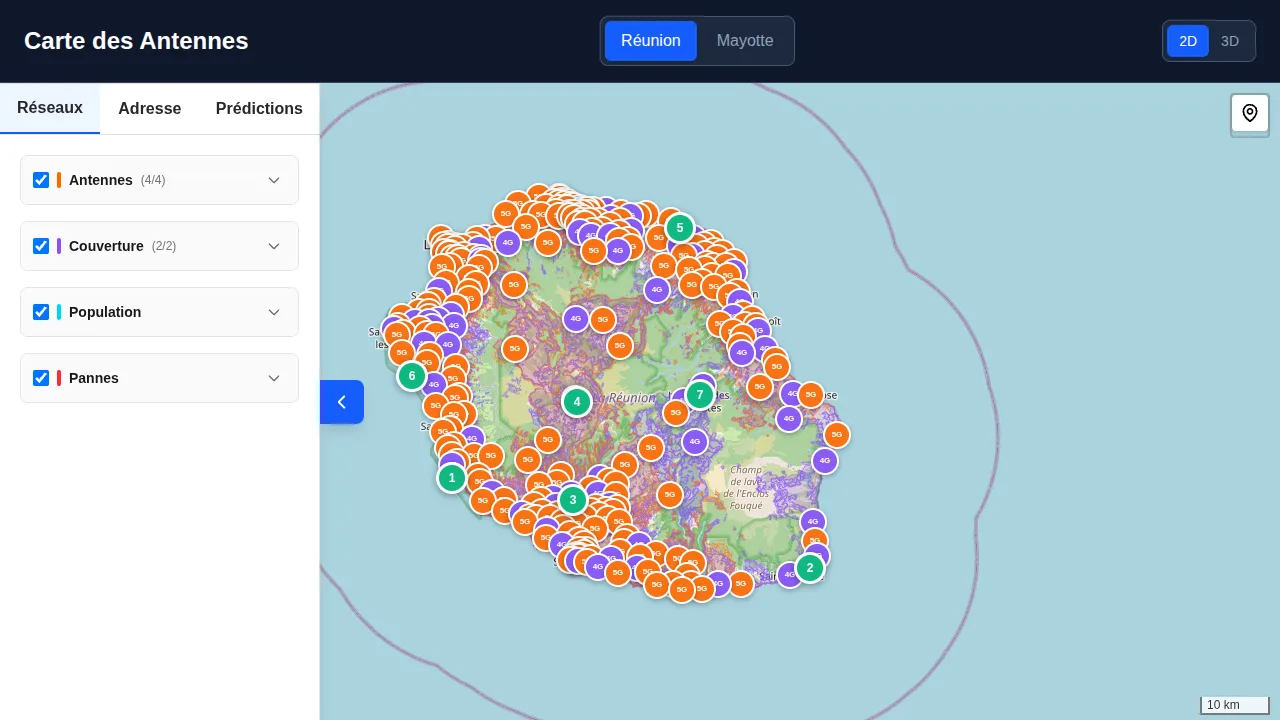
Réunion and Mayotte, two French overseas departments, have about 3,100 mobile antennas between them. SignalMap puts them all on one map and answers three questions:
- What signal would I get standing here? Click anywhere and see the strength and the number of bars, per operator and per generation, from 2G to 5G.
- Where are the antennas, and which are down? Every site is pinned on the map, with the current outages.
- Where should a new antenna go? The map suggests sites where people are least well served.
It started as a one-week school project with a team of four in January 2026. I carried it on afterwards, and in September 2026 it became something that can be deployed and kept running, not just a demo.
How it works
Working out the signal at a point takes a lot of computation over the terrain, too slow to do on each click. So the coverage of every antenna is computed once, ahead of time, and saved as a picture of signal strengths. A click then only reads a few pixels, and the answer comes back instantly.
What I took from it
- Moving heavy work out of the moment someone clicks, into a step done ahead of time, is often the best fix for both speed and safety.
- Writing down why things are the way they are, in a guide for the next person, is as much a part of the product as the code.


